This should only take a sec…


They made my transfer so simple and always make sure I know the best savings for me!
TXU has always provided me with excellent customer service and that is why I continue to do with business with them even with all the options. The customer service is amazing.
Helped me get the best plan possible for me, and gave me tips to save money through the harsh weather.
Customer service was very helpful and accommodating when I had questions about my account.


Our plans are made to help you save around the way you live. We'll help you find the best one for you and your home.
In fact, your satisfaction's guaranteed. It's one of the reasons we have thousands of 5-star Google Reviews.
We're grateful to our customers who have made us Texas' #1 choice for decades, and we're always ready to help you.


All our term plans shield you from fluctuating wholesale energy rates and unpredictable weather so you can rest easy all year long. Plus, your rate comes with no hidden fees.
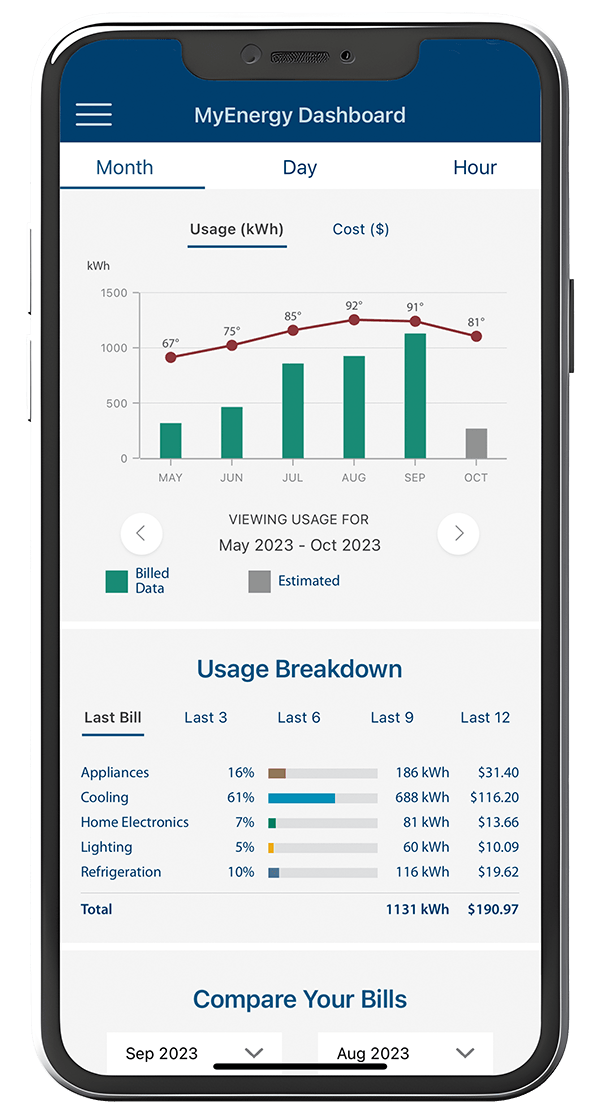
Save time and energy with our app: See your usage anytime, view and pay your bill with ease, set up helpful alerts and more.
![]()
![]()

From plans that offer free charging for your EV to rooftop solar buyback plans to renewable options you can add to any plan, you can power your home or business with energy that supports a cleaner Texas.

Whether you’re a homeowner, renting an apartment or own a business, we can help you save with the right plan. Coming soon to Lubbock! Chat with us, call us at 855-752-0086 or continue shopping below.

1 Free energy charges and time periods defined in plan EFL. TDU and other billed charges apply normally.
2 Live Your Free $700 Savings - Based on forecasted savings using TXU Energy customers' average usage and pricing data over one year. Individual results may vary based on plan and usage.